BGL Technical Notes
BGL Technical Notes
Estimating Fault Seal and Capillary Sealing Properties in the Visund Field, North Sea.
Abstract
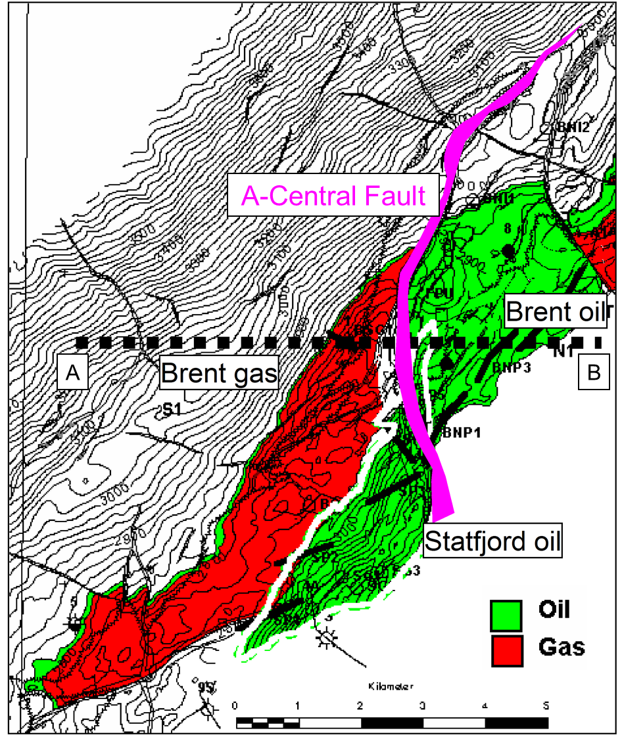
This study investigates the difference in seal/leakage mechanisms across the A-Central Fault, a
major trap bounding fault located in the westerly dipping fault block of the Visund Field, Brent
Province, North Sea. The Shale Gouge Ratio (SGR) algorithm is used to predict fault-zone
composition, using subsurface mapping and petrophysical data. These data are then used to model
threshold capillary pressure (Pc) and from this derive an estimate of maximum possible hydrocarbon
column height. Modelling suggests that the self-juxtaposed reservoirs are likely to have poorer
sealing potential and therefore across-fault leakage can occur in these regions. However, the
Brent-Statfjord juxtapositions are predicted to have higher SGR, and subsequently, higher Pc and
hydrocarbon column heights (predicted oil: 25-250 m or gas column: 15-150 m). Observed data confirm
these suppositions.
Click here to download PDF
|
Figure 1. Location map of the Visund Field showing geological structure and well locations. |

|
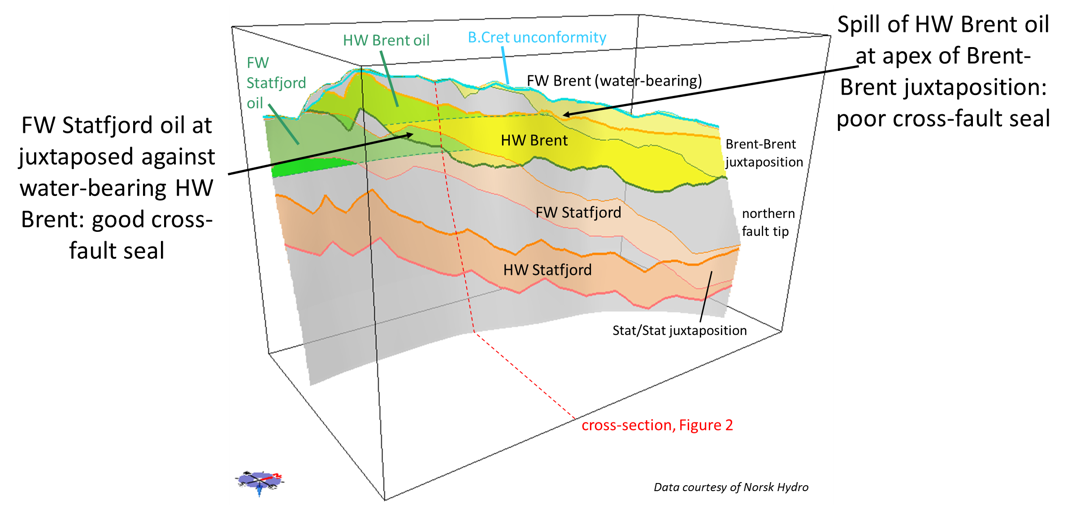
Figure 2. W-E oriented cross section (location indicated on Figure 1) through the A-Central Fault showing footwall and hanging wall stratigraphy. |

|
Figure 3. Definition of the Shale Gouge Ratio, after Yielding et al., 1997, and Freeman et al., 1998. At any point on the fault surface the SGR is equal to the net shale/clay content of the rocks that have slipped past that point. If lithotypes are incorporated into the fault zone in the same proportions as they occur in the wall rocks, then SGR is an estimate of the fault zone composition. |
|
Figure 4. Allan diagram along the A-Central Fault. Pale yellow: Brent sands in the footwall. Dark yellow: Brent sands in the hanging wall. Pale orange: Statfjord sands in the footwall. Dark orange: Statfjord sands in the hanging wall. Brent self-juxtaposition and Statfjord self-juxtaposition is present at the northern end of the fault. Brent sands in the hanging wall are also juxtaposed against Statfjord sands in the footwall towards the southern end of the fault in the vicinity of the Visund trap. |
|
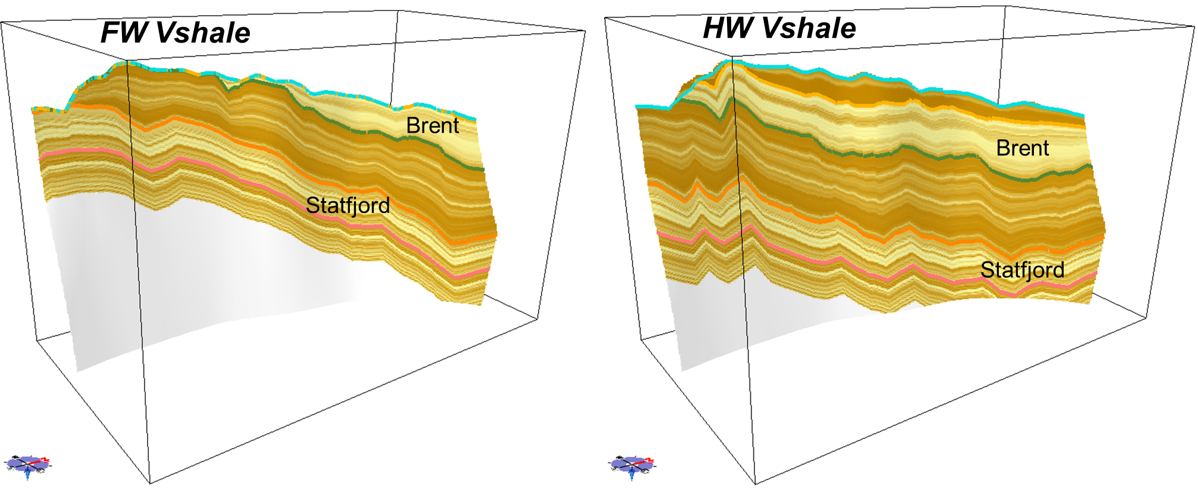
Figure 5. VShale mapping from local wells to the A-Central Fault surface displayed as footwall VShale and hanging wall VShale. Brown colours indicate areas estimated to have a higher proportion of shale; yellow/cream colours indicate areas estimated to have a higher proportion of sand. |
|
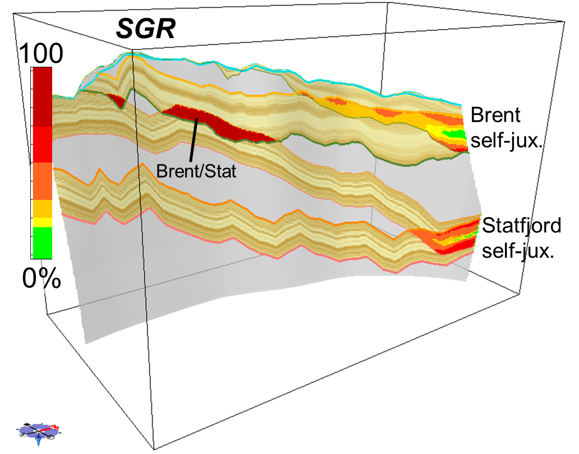
Figure 6. VShale mapping displayed only in the footwall and hanging wall sand intervals along the A-Central Fault surface. Brown colours indicate areas estimated to have a higher proportion of shale; yellow/cream colours indicate areas estimated to have a higher proportion of sand. Areas of sand-sand juxtaposition are coloured for the SGR. It can be seen that the areas of Brent self-juxtaposition and Statfjord self-juxtaposition (towards the northern end of the fault), SGR values are variable ranging between low SGR (<10) and high SGR (>70), indicating a low probability of fault seal. However, in the region of Brent-Statfjord juxtaposition, predicted SGR values are high (>70) indicating a high probability of fault seal. |

|
Figure 7. Estimated capillary sealing properties of the A-Central fault-zone, calculated from the SGR and geohistory, using published relationships (Manzocchi et al., 2002, Sperrevik et al., 2002, Yielding, 2002, and Bretan et al., 2003). Both in-situ and core-plug measurements suggest that fault-zone threshold pressures can support a corresponding buoyancy pressure of a 25-250 m oil column or 15-150 m gas column. |
|
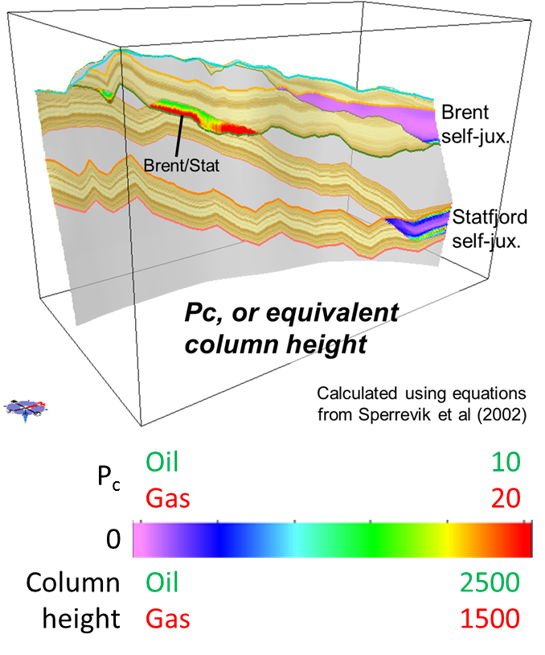
Figure 8. Estimates of supportable hydrocarbon column heights using the equations from Sperrevik et al., 2002. Blue/purple colours indicate low capillary pressures (Pc) and a corresponding low oil/gas column height. Red/orange colours indicate high capillary pressure (Pc) and a corresponding high oil/gas column height. In the region of Brent self-juxtaposition and Statfjord self-juxtaposition (towards the northern end of the fault) it can be seen that Pc and column heights are predicted to be variable, but overall will be low. In the region of Brent-Statfjord juxtaposition (towards the southern end of the fault) it can be seen that Pc and column heights are predicted to be significantly higher. |